Megan Schlebecker

B.A. Psychology and English
Data Analysis and Data Visualization
View My LinkedIn Profile
Portfolio
All projects are linked to respective repositories in GitHub, please click the name of the project for futher information.
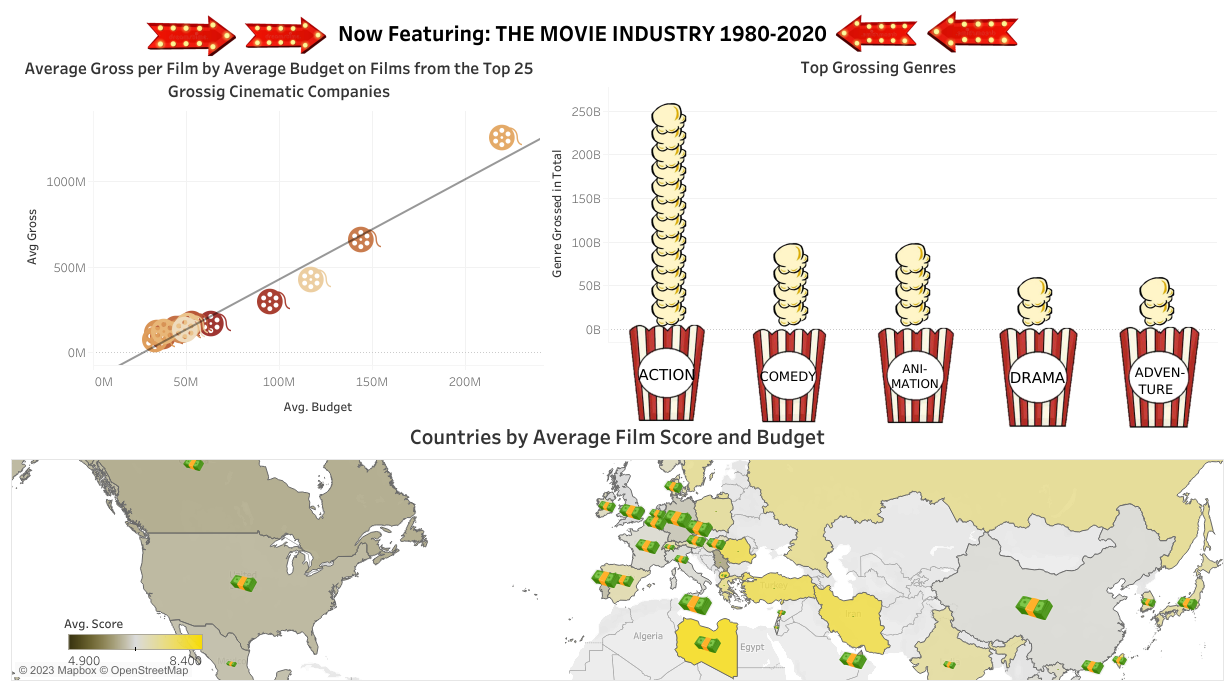
Movie Industry Correlations
This was a quick project I did within in Python to help practice skills relating to examining and visualizing correlations. I used a Kaggle data source on the movie industry to look at some the strongest relationships between different contributing factors and the total gross box office sales. In this repository you’ll find a Jupyter Notebook with all the Python script used in this project, along with a link to the visualization I completed of this project in Tableau, as well.
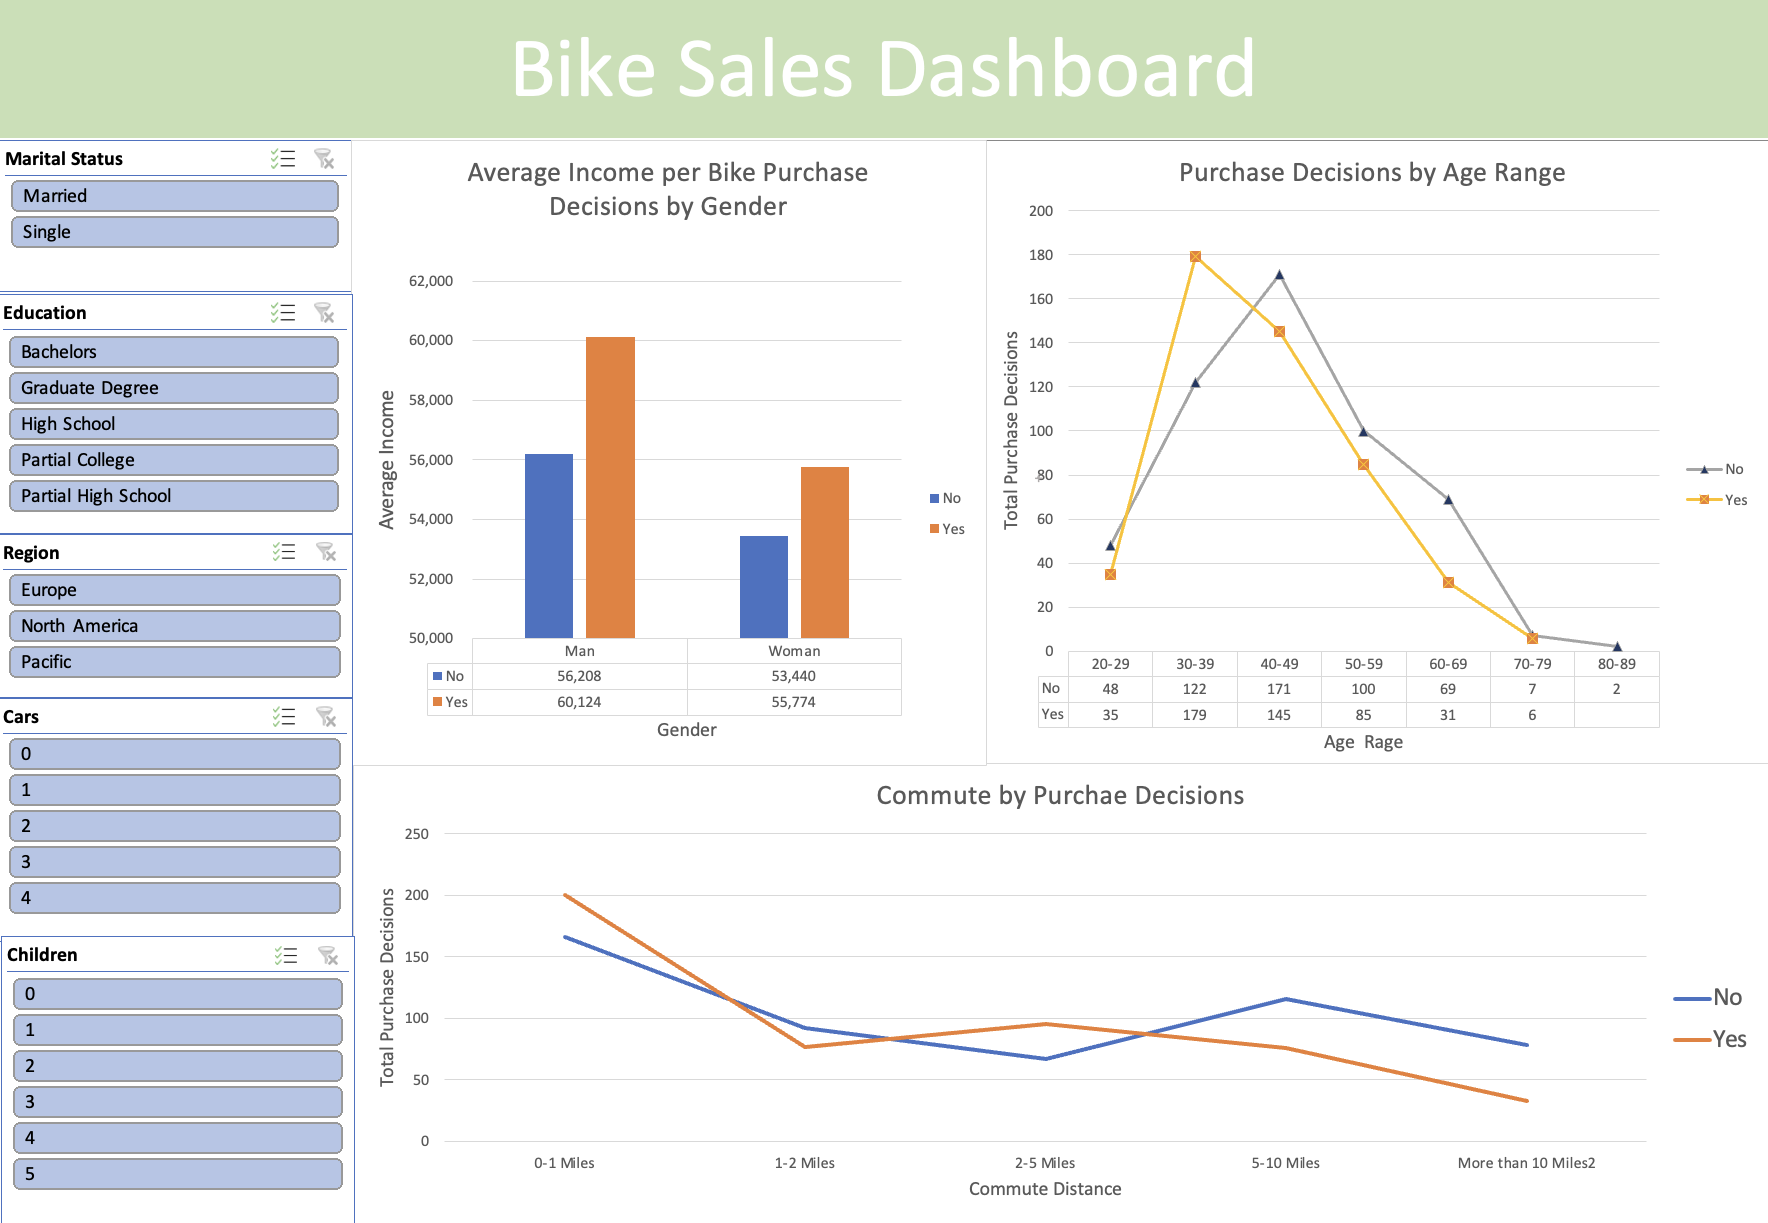
Bike Sales: Dashboard in Excel
In this short project, I practiced my Excel skills by cleaning provided data, creating pivot tables, and an interactive dashboard all within in Excel. Please visit the linked respository to view related files.
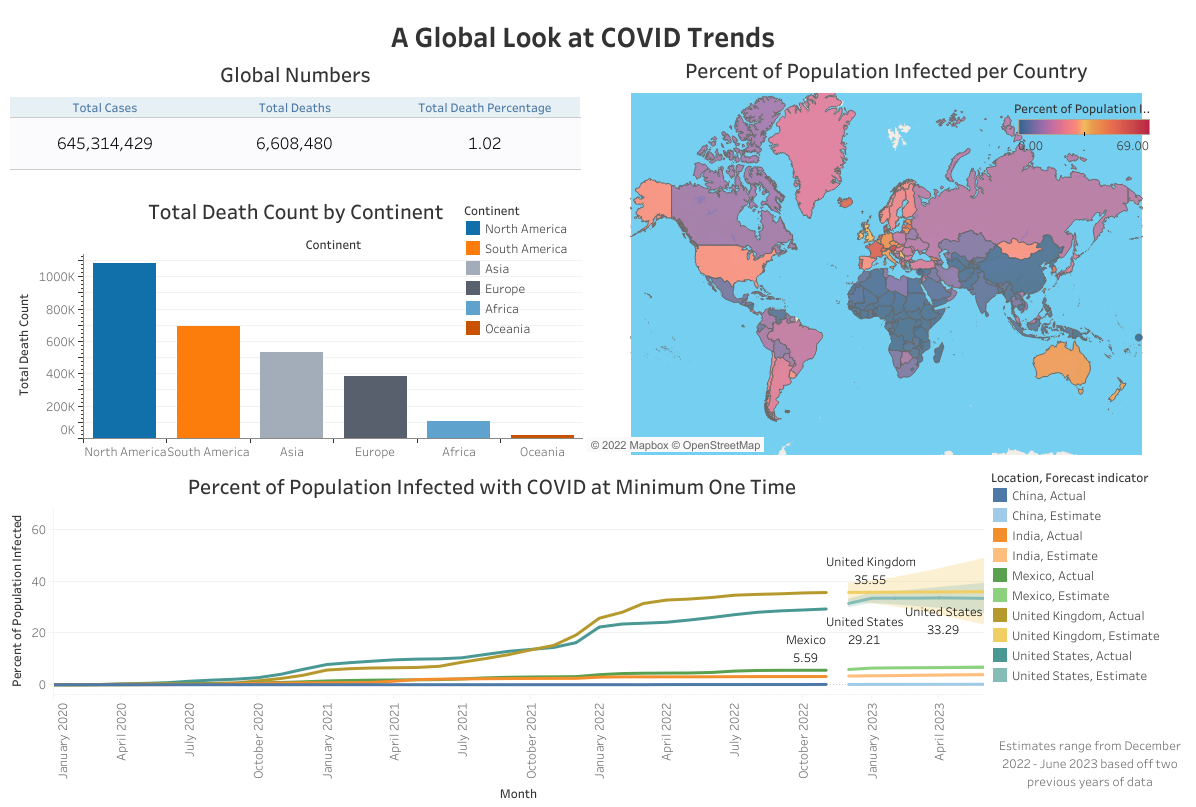
Global COVID Trends
The purpose of this project was to examine trends and patterns across the globe in relation to the spread of COVID, deaths attributed to the illness, and vaccinations, as well. Within the linked resposity (above), you’ll find all relating files to the data analysis project, including raw data, cleaned data, and a markdown of SQL queries. In addition, an in-depth visualization was created using Tableau.
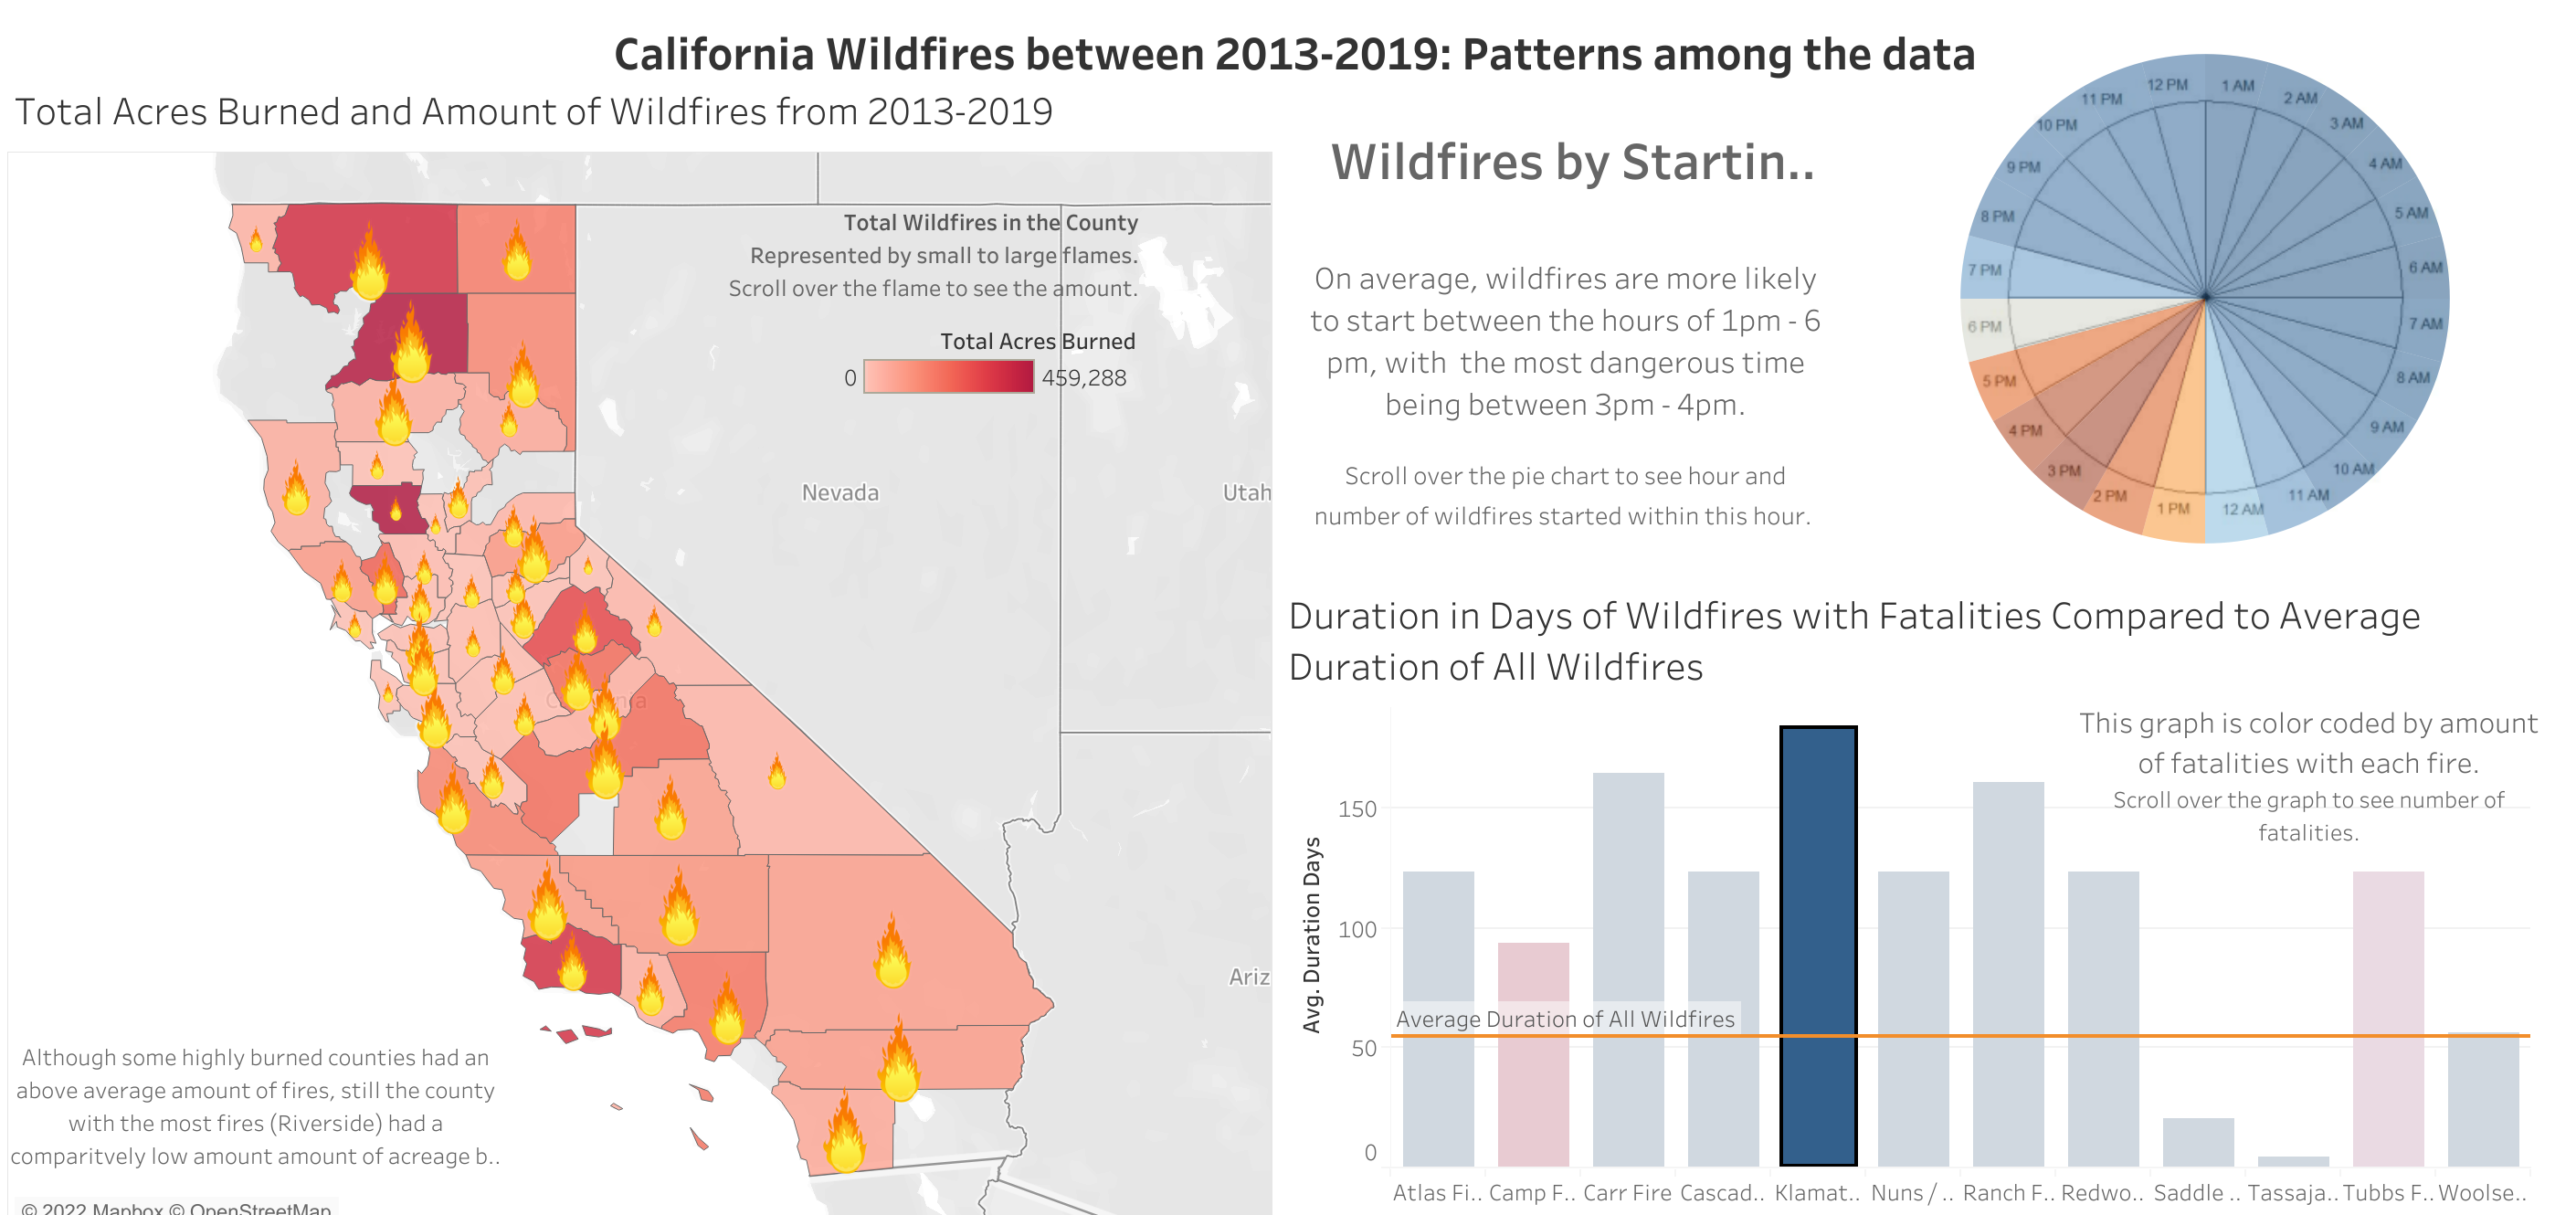
California Wildfires 2013-2019: Patterns among the Data
This project was my capstone project for the Google Data Analytics Professional Certfication course on Coursera. I was hoping to exmaine different patterns of wildfires within California in order to potentially find ways of preventing fires or decreasing duration of wildfires as we are unfortunately see the number of wildfires increase due to climate change. Wtihin the linked repository, you’ll find a markdown with a detailed explanation the process I took to complete this project along with examples and pictures from my SQL queries. After I completed the SQL analysis, I created a detailed Tableau dashboard that is interactive. At the end, I was able to find some interesting trends including most common times of wildfires and differences in wildfire patterns across counties in California, in addition to some points for further analysis.
Please reach out for questions or comments! Thank you!